Marching Squares
One of my goals was to be able to generate topographic maps with nice contour lines given that I think Perlin Noise gives a very nice base to generate the terrain, so I set off to try and draw those curves. After a bit of trial and error all my naive approaches failed and when I searched a bit I came across the Marching Squares algorithm as a likely tool so I decided to tackle that first.
As Wikipedia tersely puts it
Marching squares is a computer graphics algorithm that generates contours for a two-dimensional scalar field (rectangular array of individual numerical values).
The algorithm itself has three steps:
Taking a grid of values define a threshold - isovalue - and build a binary grid with 1 for values above the isovalue and 0 for all others
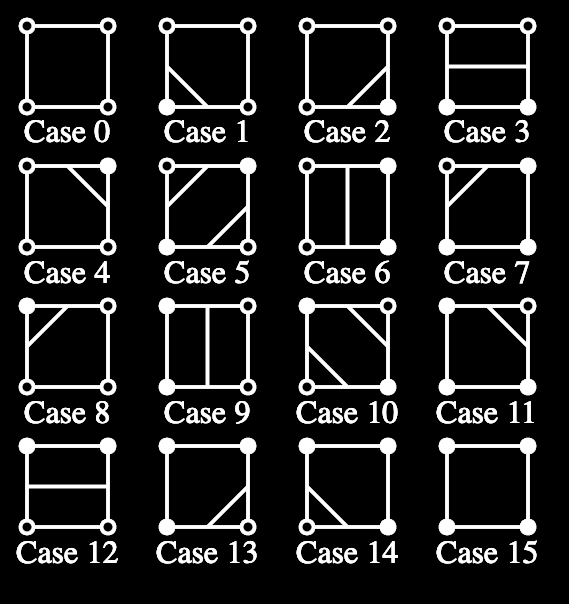
Traverse the new grid looking for 2x2 cells of values and calculate a value for what that combination of 1s and 0s looks like
Using a contour line lookup table, draw the lines on the screen.
Let me illustrate how I approached the steps:
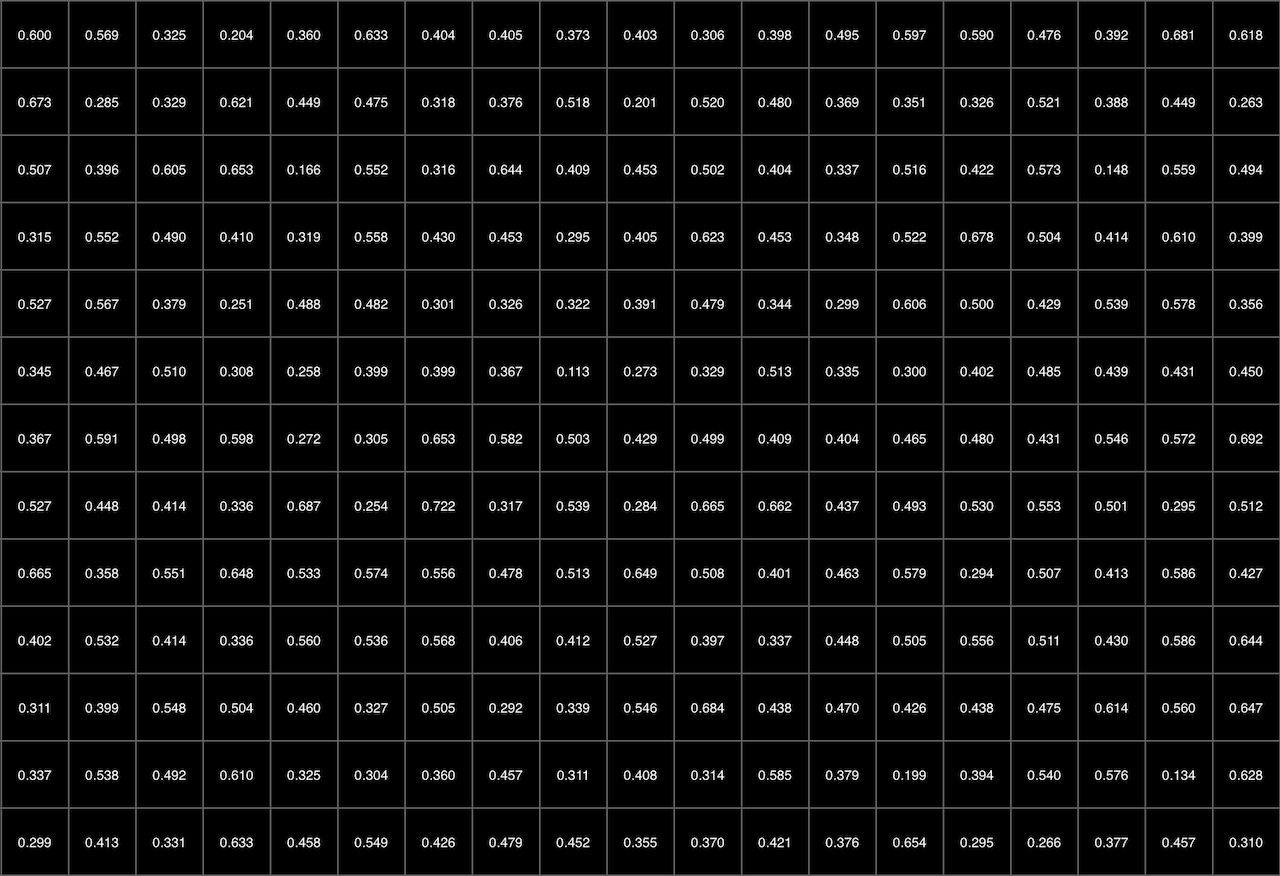
First, I needed to a grid of values, and thanks to Perlin Noise it’s easy to generate one with values that make some kind of sense for this exercise
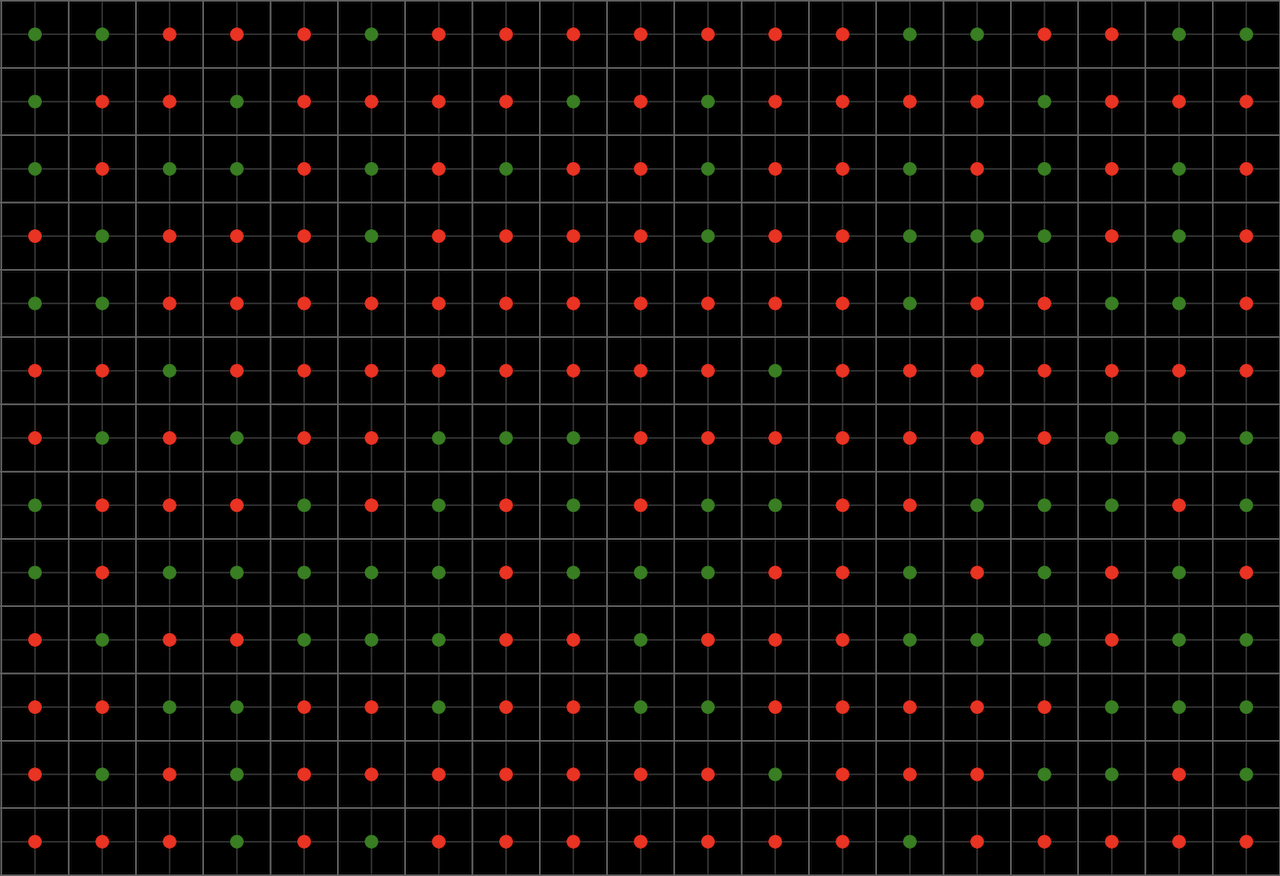
As the perlin noise values range from 0 to 1, I put the threshold (isovalue) at 0.5, anything above that would be a 1 on our new grid. As we’re taking 2x2 chunks of this new grid, we’re centering the result between 4 points, which sort of looks like this
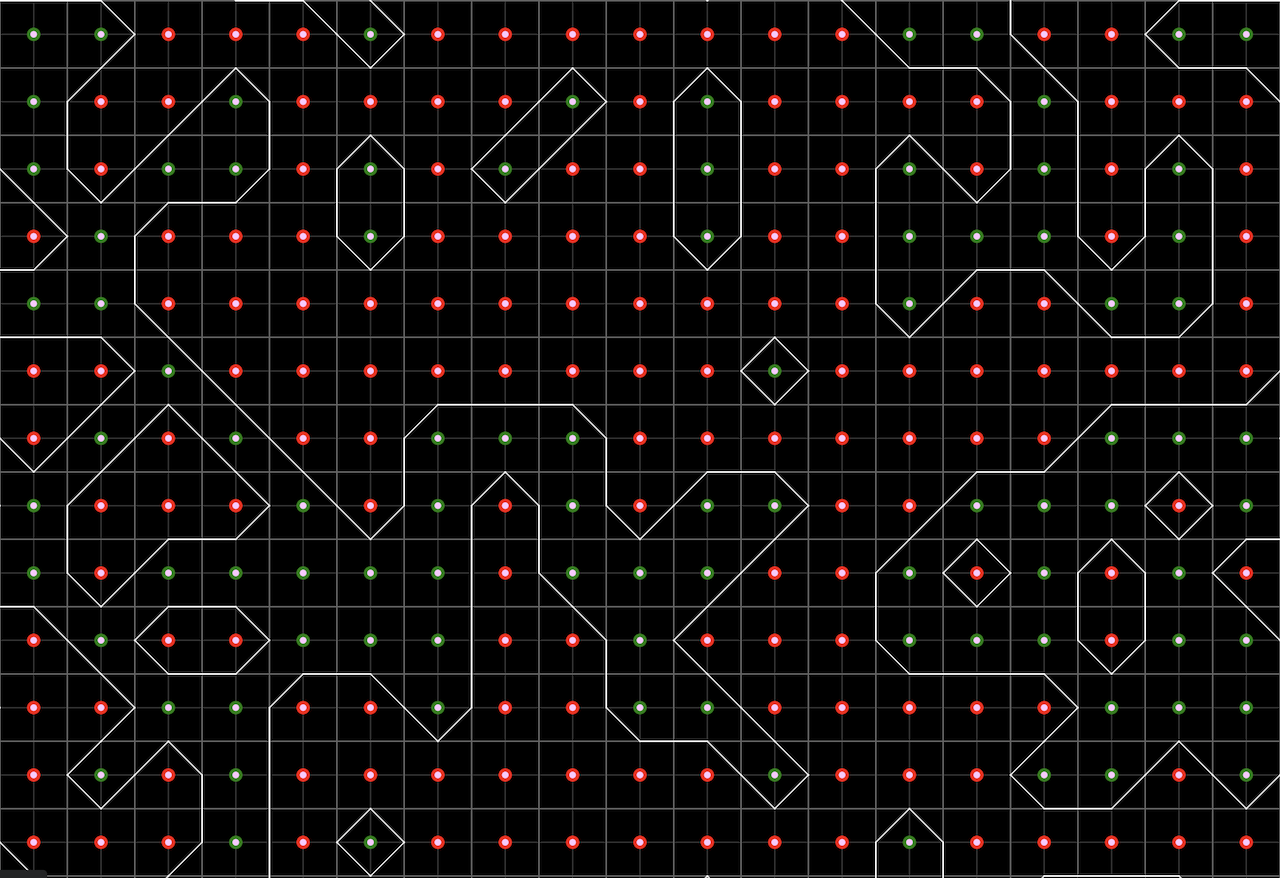
With this in hand we can now build our contour lines and to do that, we need to walk the new grid taking 2x2 cells and mapping them to a specific shape
And so we end up with this
There is a final detail to this last step. The algorithm does require that we:
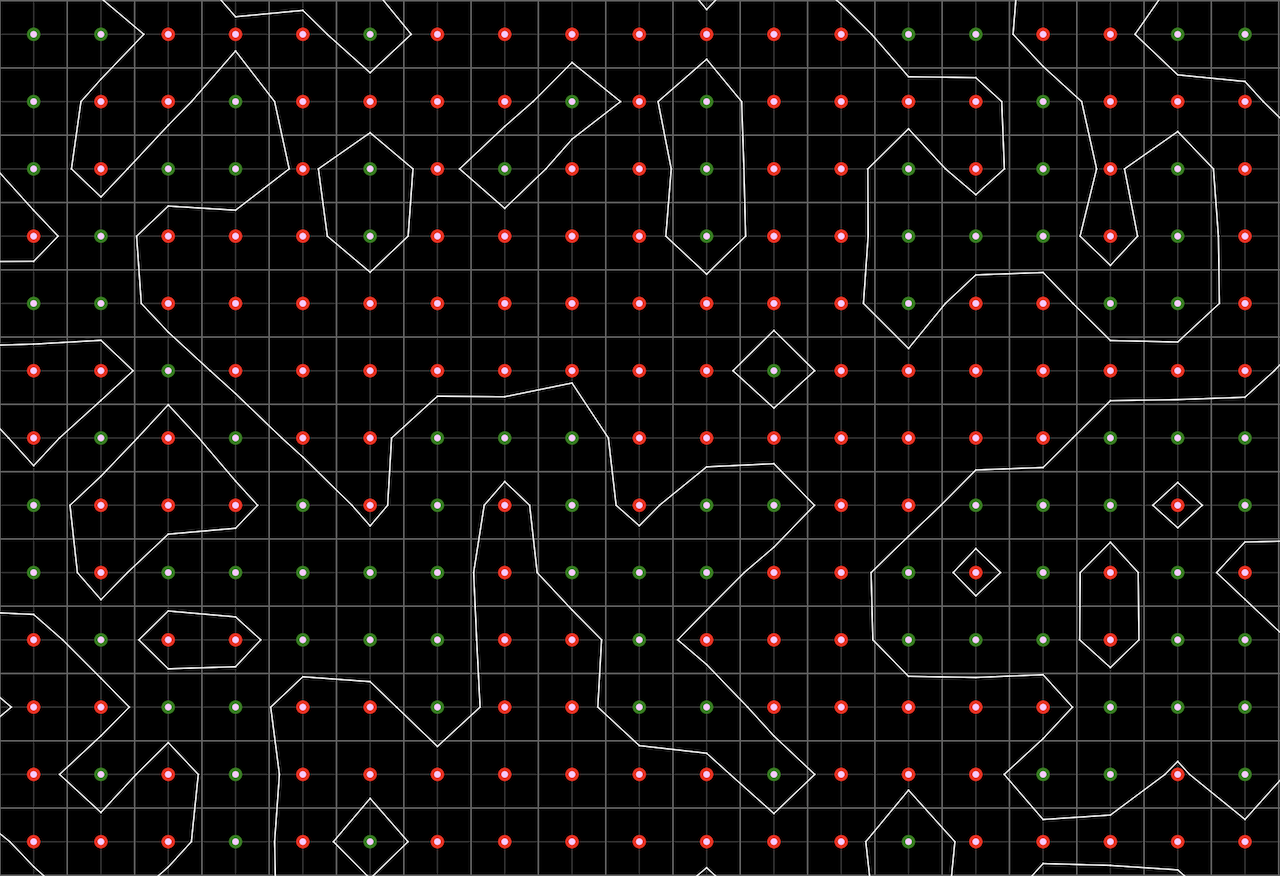
Apply linear interpolation between the original field data values to find the exact position of the contour line along the edges of the cell.
The way I approached this is rather clumsy, what I’ve done was take the two values at the edge I’m drawing the line and sort of calculate a percentage and use that to position the contour line. It does look slightly nicer, but I’m not sure this is the correct implementation.
References:
' use strict '
// Avoiding Global Mode: https://github.com/processing/p5.js/wiki/Global-and-instance-mode
const experiment = ( sketch ) => {
//
// Configuration
//
let container = document . getElementById ( ' sketch-holder ' )
let canvas_el
let grid_field = []
let cells_grid = []
let grid_size_in_pixels = 30
let half_grid_step = Math . floor ( grid_size_in_pixels / 2 )
// Perlin Noise space repeats after a while, so we'll scope increments to a max X of 100
let noise_space_increment = ( 100 / container . clientWidth ) * grid_size_in_pixels
let debug_mode = false
let threshold_value = 0.5
let z_index = 0
let z_increment = 0.001
// Controls
let controls = {
play_pause_toggle : document . getElementById ( " experiment-control-pause-toggle " ),
save : document . getElementById ( " experiment-control-save " ),
debug : document . getElementById ( " experiment-control-debug-mode " )
}
//
// P5.js touchpoints
//
sketch . setup = () => {
canvas_el = sketch . createCanvas ( container . clientWidth , container . clientHeight )
canvas_el . parent ( container )
buildNoiseField ( z_index )
buildCellGrid ()
installControlHandlers ()
sketch . noLoop ()
}
sketch . draw = () => {
let x , y
sketch . background ( 0 )
if ( debug_mode ) {
for ( x = 0 ; x < grid_field . length ; x ++ ) {
for ( y = 0 ; y < grid_field [ x ]. length ; y ++ ) {
sketch . push ()
sketch . translate ( x * grid_size_in_pixels , y * grid_size_in_pixels )
// sketch.textSize(10)
// sketch.fill(255)
// sketch.textAlign(sketch.CENTER, sketch.CENTER)
// sketch.text(grid_field[x][y].toFixed(3), half_grid_step, half_grid_step)
sketch . strokeWeight ( 1 )
sketch . stroke ( " rgba(100, 100, 100, 1) " )
sketch . line ( 0 , 0 , grid_size_in_pixels , 0 )
sketch . line ( 0 , 0 , 0 , grid_size_in_pixels )
sketch . translate ( half_grid_step , half_grid_step )
sketch . stroke ( " rgba(100, 100, 100, 0.5) " )
sketch . line ( 0 , 0 , grid_size_in_pixels , 0 )
sketch . line ( 0 , 0 , 0 , grid_size_in_pixels )
sketch . strokeWeight ( 10 )
sketch . stroke (( grid_field [ x ][ y ] > threshold_value ) ? " green " : " red " )
sketch . point ( 0 , 0 )
sketch . pop ()
}
}
}
// Draw contours
var lines = []
var ratios = []
for ( x = 0 ; x < grid_field . length - 1 ; x ++ ) {
for ( y = 0 ; y < grid_field [ x ]. length - 1 ; y ++ ) {
lines = []
sketch . push ()
sketch . translate ( x * grid_size_in_pixels + half_grid_step , y * grid_size_in_pixels + half_grid_step )
if ( debug_mode ) {
sketch . strokeWeight ( 5 )
sketch . stroke ( " rgb(255, 200, 255) " )
sketch . point ( 0 , 0 )
}
sketch . noFill ()
sketch . strokeWeight ( 1 )
sketch . stroke ( 255 )
// CCW Edges
//
// The calculations bellow are meant to nudge the standard Marching Square shapes a little bit
//
// * -- 3 -- *
// | |
// 0 2
// | |
// * -- 1 -- *
//
ratios = [
grid_field [ x ][ y ] / ( grid_field [ x ][ y + 1 ] + grid_field [ x ][ y ]),
grid_field [ x ][ y + 1 ] / ( grid_field [ x + 1 ][ y + 1 ] + grid_field [ x ][ y + 1 ]),
grid_field [ x + 1 ][ y ] / ( grid_field [ x + 1 ][ y + 1 ] + grid_field [ x + 1 ][ y ]),
grid_field [ x ][ y ] / ( grid_field [ x + 1 ][ y ] + grid_field [ x ][ y ]),
]
switch ( cells_grid [ x ][ y ]) {
// o-----o
// | |
// |\ |
// *-----o
case 1 :
case 14 :
lines . push ([
0 , grid_size_in_pixels * ratios [ 0 ],
grid_size_in_pixels * ratios [ 1 ], grid_size_in_pixels
])
break ;
// o-----o
// | |
// | /|
// o-----*
case 2 :
case 13 :
lines . push ([
grid_size_in_pixels * ratios [ 1 ], grid_size_in_pixels ,
grid_size_in_pixels , grid_size_in_pixels * ratios [ 2 ]
])
break ;
// o-----o
// |_____|
// | |
// *-----*
case 3 :
case 12 :
lines . push ([
0 , grid_size_in_pixels * ratios [ 0 ],
grid_size_in_pixels , grid_size_in_pixels * ratios [ 2 ]
])
break ;
// o-----*
// | \|
// | |
// o-----o
case 4 :
case 11 :
lines . push ([
grid_size_in_pixels * ratios [ 3 ], 0 ,
grid_size_in_pixels , grid_size_in_pixels * ratios [ 2 ]
])
break ;
// o-----*
// |/ |
// | /|
// *-----o
case 5 :
lines . push ([
0 , grid_size_in_pixels * ratios [ 0 ],
grid_size_in_pixels * ratios [ 3 ], 0
])
lines . push ([
grid_size_in_pixels * ratios [ 1 ], grid_size_in_pixels ,
grid_size_in_pixels , grid_size_in_pixels * ratios [ 2 ]
])
break ;
// o-----*
// | | |
// | | |
// o-----*
case 6 :
case 9 :
lines . push ([
grid_size_in_pixels * ratios [ 3 ], 0 ,
grid_size_in_pixels * ratios [ 1 ], grid_size_in_pixels
])
break ;
// o-----*
// |/ |
// | |
// *-----*
case 7 :
case 8 :
lines . push ([
0 , grid_size_in_pixels * ratios [ 0 ],
grid_size_in_pixels * ratios [ 3 ], 0
])
break ;
// o-----*
// | \|
// |\ |
// *-----*
case 10 :
lines . push ([
0 , grid_size_in_pixels * ratios [ 0 ],
grid_size_in_pixels * ratios [ 1 ], grid_size_in_pixels
])
lines . push ([
grid_size_in_pixels * ratios [ 3 ], 0 ,
grid_size_in_pixels , grid_size_in_pixels * ratios [ 2 ]
])
break ;
}
lines . forEach ( line => {
sketch . line (
line [ 0 ],
line [ 1 ],
line [ 2 ],
line [ 3 ],
)
})
sketch . pop ()
}
}
z_index += z_increment
buildNoiseField ( z_index )
buildCellGrid ()
}
sketch . mouseClicked = () => {
sketch . redraw ()
}
//
// Helper methods
//
function buildNoiseField ( time = 0 ) {
let x , y
grid_field = []
for ( x = 0 ; x <= Math . floor ( sketch . width / grid_size_in_pixels ); x ++ ) {
grid_field [ x ] = []
for ( y = 0 ; y <= Math . floor ( sketch . height / grid_size_in_pixels ); y ++ ) {
grid_field [ x ][ y ] = sketch . noise (
x * noise_space_increment + time ,
y * noise_space_increment ,
0 )
}
}
}
function buildCellGrid () {
let x , y
for ( x = 0 ; x < grid_field . length - 1 ; x ++ ) {
cells_grid [ x ] = []
for ( y = 0 ; y < grid_field [ x ]. length - 1 ; y ++ ) {
// Treat CCW corners as part of a binary number (1,2,4,8)
// 8 -- 4
// | |
// 1 -- 2
cells_grid [ x ][ y ] = parseInt (
[
( grid_field [ x ][ y ] > threshold_value ) ? " 1 " : " 0 " ,
( grid_field [ x + 1 ][ y ] > threshold_value ) ? " 1 " : " 0 " ,
( grid_field [ x + 1 ][ y + 1 ] > threshold_value ) ? " 1 " : " 0 " ,
( grid_field [ x ][ y + 1 ] > threshold_value ) ? " 1 " : " 0 " ,
]. join ( "" ),
2
)
}
}
}
function installControlHandlers () {
//
// Pause / Play
//
controls . play_pause_toggle . addEventListener ( " click " , function () {
this . querySelectorAll ( ' i ' ). forEach ( ( el ) => {
if ( ! el . classList . contains ( ' hide ' )) { // Look for the active icon
if ( el . classList . contains ( ' fa-pause-circle ' )) {
sketch . noLoop ()
} else if ( el . classList . contains ( ' fa-play-circle ' )) {
sketch . loop ()
}
}
el . classList . toggle ( ' hide ' )
})
})
// Save file
controls . save . addEventListener ( " click " , function () {
sketch . save ( canvas_el , `marching-squares_ ${ grid_size_in_pixels } _ ${ Math . floor ( Date . now () / 1000 )} ` , ' png ' )
})
// Debug mode
controls . debug . addEventListener ( " change " , function ( event ) {
debug_mode = event . target . checked
sketch . redraw ()
})
}
}
// Wait for everything to load
if ( document . readyState === ' complete ' ) {
new p5 ( experiment )
} else {
window . onload = ( event ) => {
new p5 ( experiment )
}
} 